The one season that moved
- Source
- FBref squad shooting tables
- Period
- Premier League, 2022-23 to 2024-25
- Sample
- 60 club-seasons, about 29,700 shots
- Tools
- R (ggplot2)
- Code
- Repository, data and R script
The leftover question
In the previous article, neither shot volume nor shot yield moved in the Premier League. The only exception was 2023-24, with 27.32 shots per game, 0.1070 npG/Sh, both being the highest among the ten seasons. The article did not examine the outlier, which this article does.
Two ways a league total can rise
There are two ways a league total increases:
a) Existing teams shoot more. b) Team composition changes, with three teams relegated and three teams promoted every season.
Before explanation, the two should be distinguished.
It was the clubs that stayed
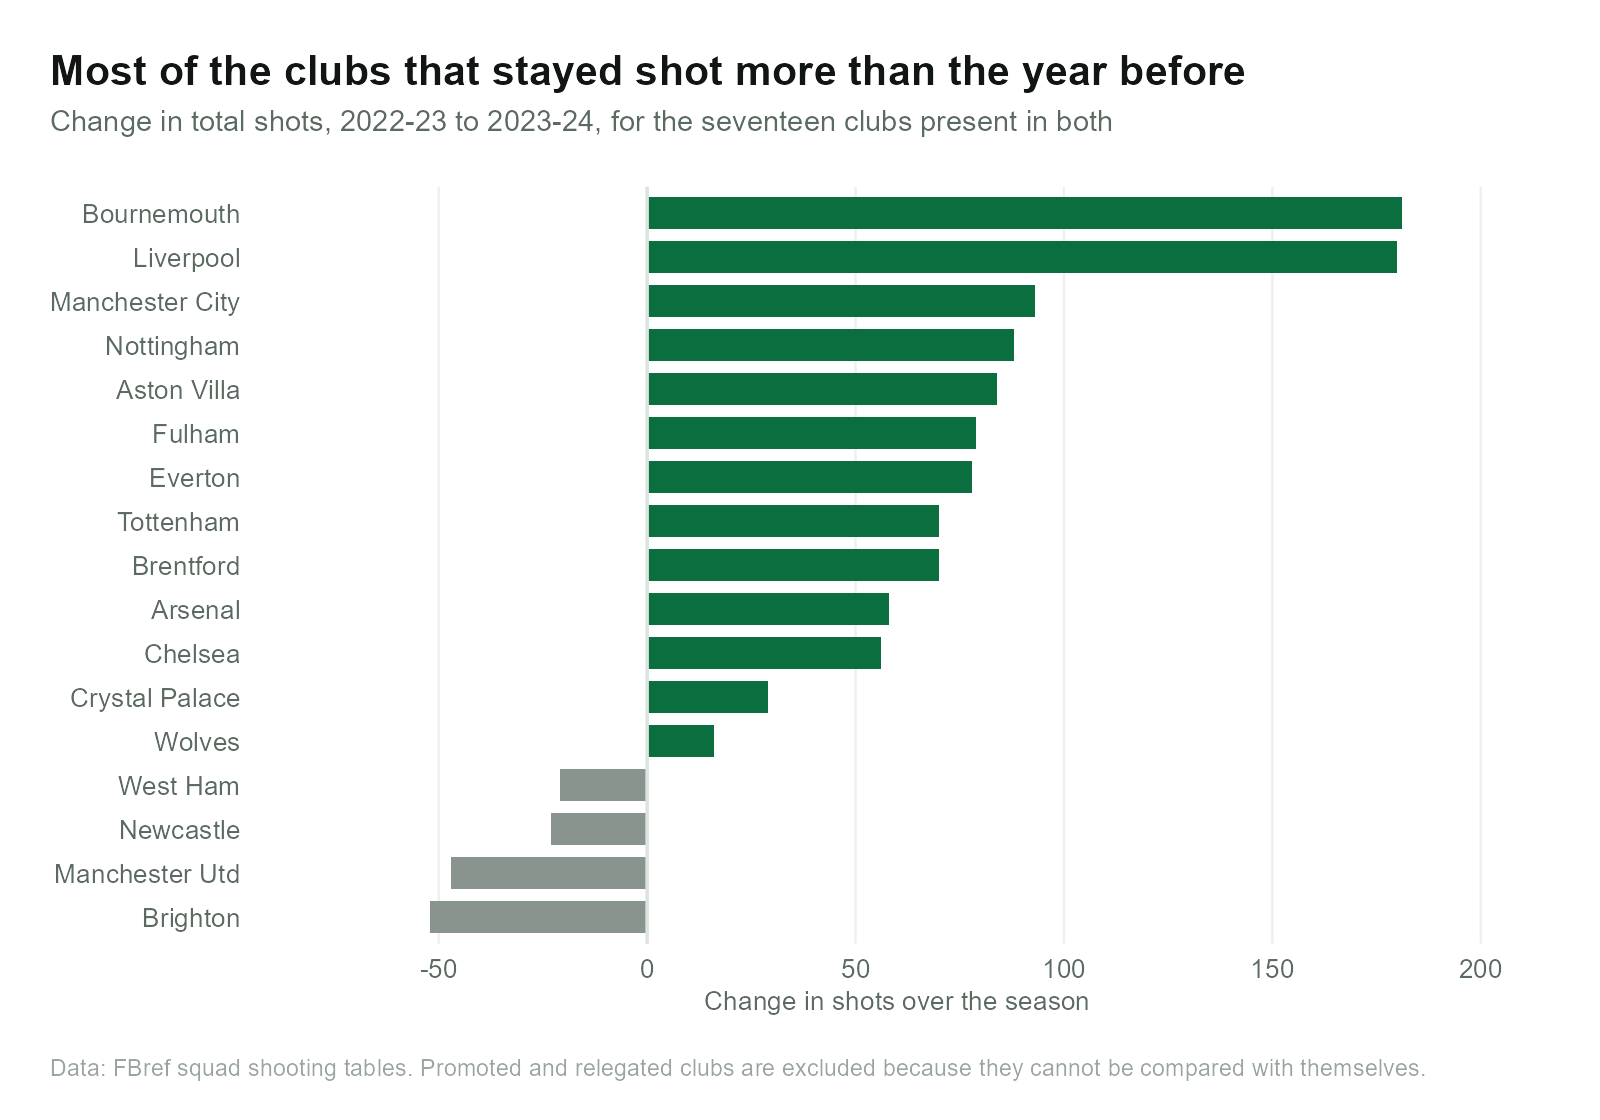
I compared 2022-23 with 2023-24. Compared to 2022-23, 2023-24 has +872 shots (+2.29 per game), where the remaining seventeen teams recorded +939 (107.7%) and the three promoted clubs took 67 fewer shots than the three relegated clubs they replaced (-7.7%). The relegated teams were Leeds United, Leicester City, Southampton, and the promoted teams were Burnley, Luton Town, Sheffield United. The share exceeds 100% because turnover pulled in the opposite direction: the clubs that stayed added 939 shots, and the change of clubs subtracted 67 of them.
The increase is broad rather than concentrated, as thirteen of the seventeen clubs that stayed took more shots, with a median of +70. Bournemouth recorded +181, and Liverpool recorded +180, which are two notably big increases.
But the scoring rate came from the bottom
| Season | League | Median | Lowest | Highest | SD |
|---|---|---|---|---|---|
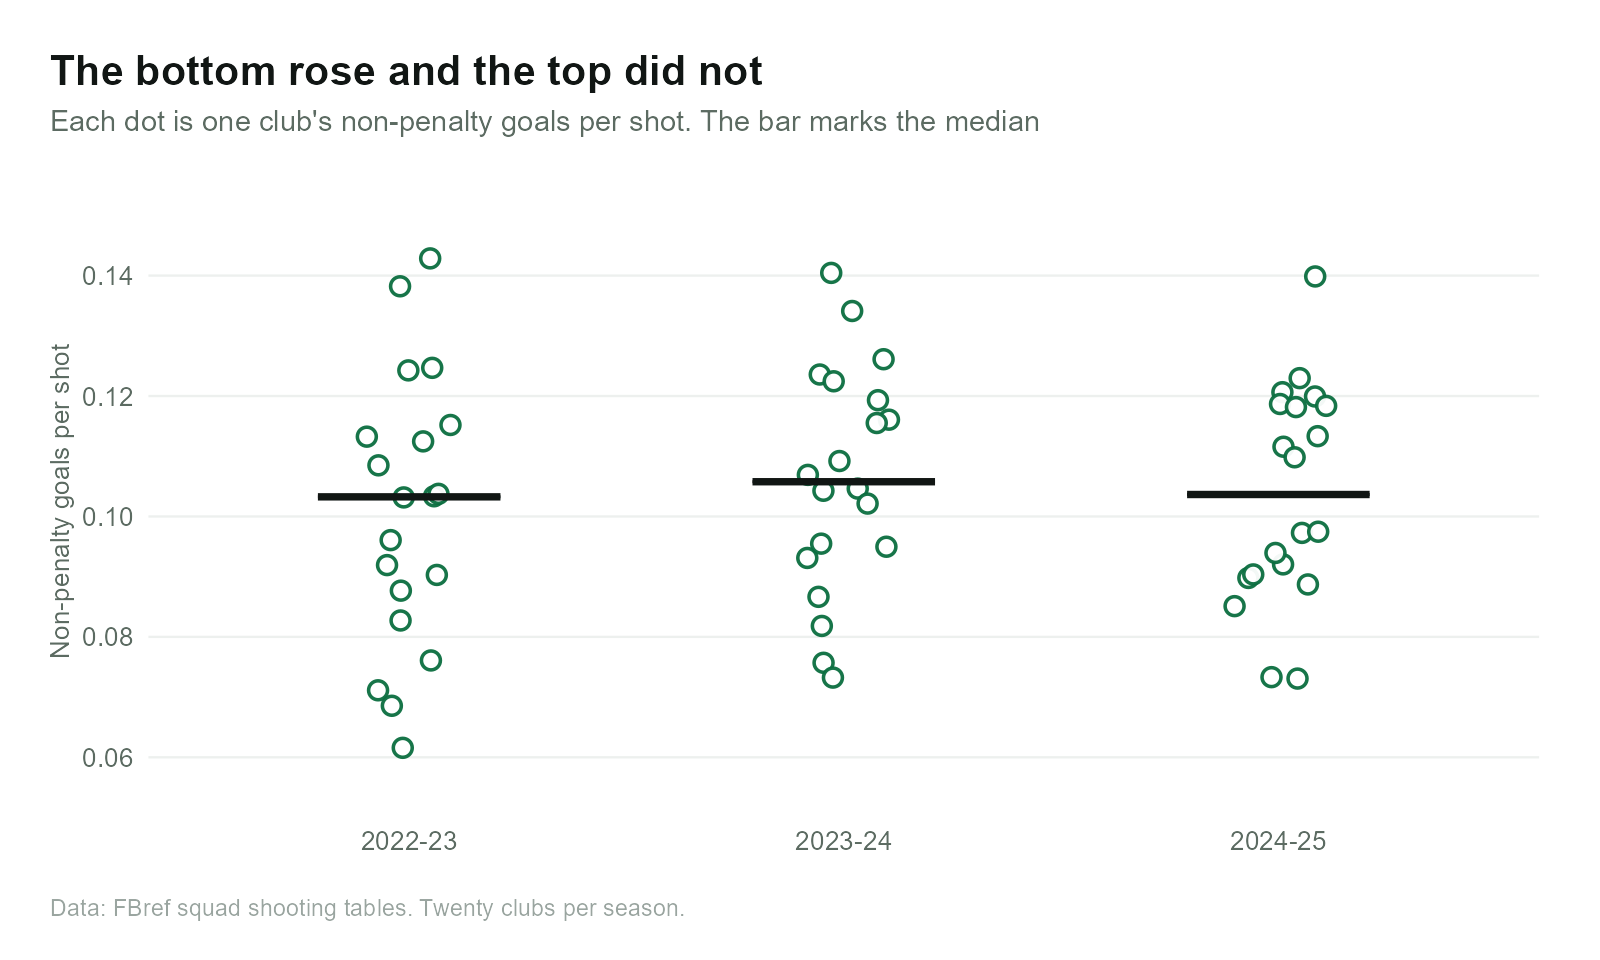
| 2022-23 | 0.1023 | 0.1033 | 0.0616 | 0.1429 | 0.0225 |
| 2023-24 | 0.1070 | 0.1058 | 0.0732 | 0.1404 | 0.0188 |
| 2024-25 | 0.1045 | 0.1036 | 0.0731 | 0.1399 | 0.0180 |
The lowest value rose from 0.0616 to 0.0732, while the highest fell from 0.1429 to 0.1404. The standard deviation also decreased. The increase of the average is attributable to the improvement of the clubs with the lowest conversion rates rather than the improvement of the clubs already converting best.
What this does not settle
There are four things that this analysis does not settle:
- The two-season comparison does not tell causality. It only shows what changed.
- Most of the values returned in 2024-25 (25.70 shots, 0.1045). It may be only a temporary phenomenon.
- I cannot find why the floor rose.
- There are no accessible shot position data, so I could not check whether these were better shots.
What's next
In the next article, I am going to take the same question to the clubs rather than the league.
Data and code. All ten CSV exports and the R script that produced these figures are in this site's repository.