Fewer long shots, same goals
Opta reported that shots from outside the penalty box fell to their lowest recorded level in the 2024-25 Premier League season, and explained it as teams learning that closer shots are more likely to become goals. If that explanation holds, the average value of a shot should have increased. Across the ten seasons of public data that remain accessible, it did not.
- Source
- FBref squad shooting tables
- Period
- Premier League, 2016-17 to 2025-26
- Sample
- 200 club-seasons, about 96,000 shots
- Tools
- R (ggplot2)
- Code
- Repository, data and R script
What ten seasons of public data can still tell us about a claim built on data that is no longer public.
The claim
Opta analyst David Segar observed 8.3 shots outside the box per game (31.7% of total shots) during the 2024-25 season (written in March 2025). This is the lowest record among the measurements that started at 2003-04 season. However, observation and explanation are totally different. Observation measures, while explanation discusses causality. This article does not observe, but tests the given explanation.
What the explanation predicts
If a team sorts out low-value shots, then the remaining shots should be better in quality.
- Prediction A: Goal rate per shot increases.
- Prediction B: Total shots decrease.
Both predictions are testable without shot position data.
Data and method
I used FBref squad shooting tables providing data from 2016-17 seasons to 2025-26 season. I measured 200 club-seasons, approximately 96,000 shots in 3,800 games. The measurement was conducted with the following metrics: shots per match, non-penalty goals per shot, Shot-on-target percentage (SoT%). I ran the analysis by R, using ggplot2.
Data of shots (Sh) are available from 2016-17 season. Separately, Opta advanced stat became inaccessible in January, 2026. I did not select a certain sample, but the data used are all that I could access. I excluded the penalty kick (PK). In this sample, PK converted to goal at 80.3% (795/990) against 10% rate for every other shot, which is roughly eight times the rate. The PK number increased after the introduction of video assistant referee (VAR). The three pre-VAR seasons produce an average of 73.7 PKs, while the seven post-VAR produce an average of 82.0 PKs. The league aggregate is used since the mean per team equally weights the team with 332 shots and the team with 781. Whether the PK stat is in the Sh is not documented, so I calculated both sides, which gave me at most 1.1% difference with the result being the same.
Goals (Gls) excluded own goals. FBref's Gls only counts goals scored by a club's own players. For 2023-24 it is 49 goals short of the official league total. An own goal is not a shot conversion, so this is the correct numerator here.
Result 1
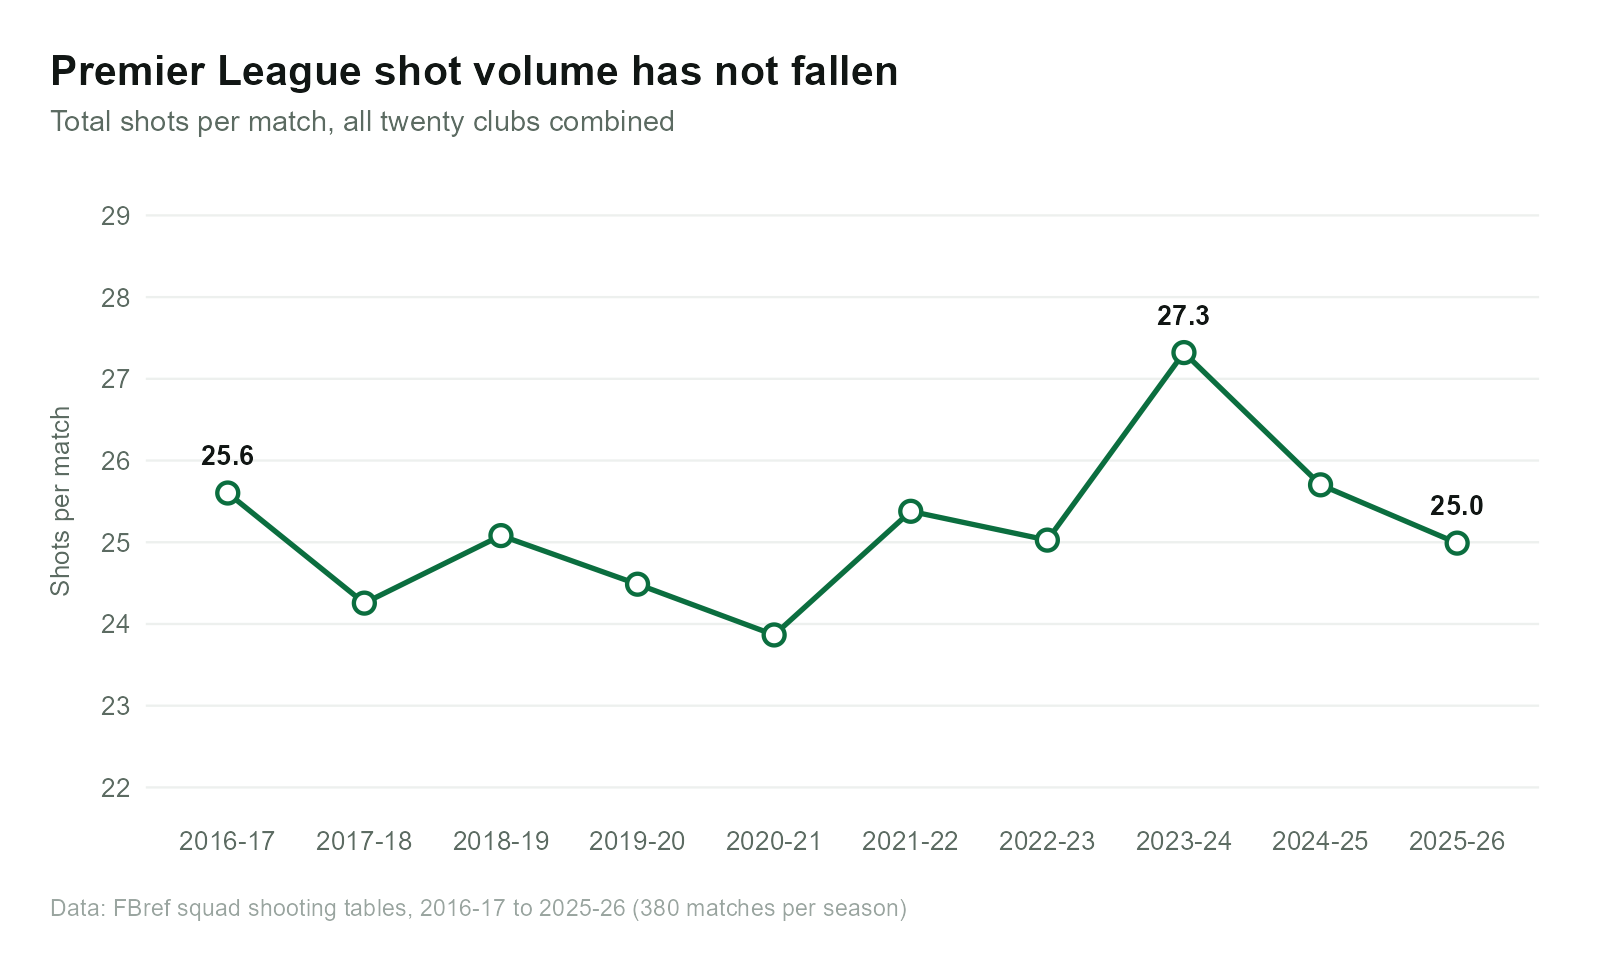
2016-17 marked 25.60, while 2025-26 marked 24.99. The latter end is lower. However, when a straight line is fitted through the ten seasons, the slope is positive. The increase is +0.115 per season, +1.03 in aggregate over ten seasons, with R² = 0.132.
The fact that the signs of the two methods are different is the finding. A series whose direction depends on whether you compare its endpoints or fit a line through it is a series that has not moved. The only notable movement is the 27.32 of 2023-24. After that it returns to 25.70 and then 24.99. The lowest is 23.87 of 2020-21, which was the season played without crowds.
Prediction B does not hold.
Result 2
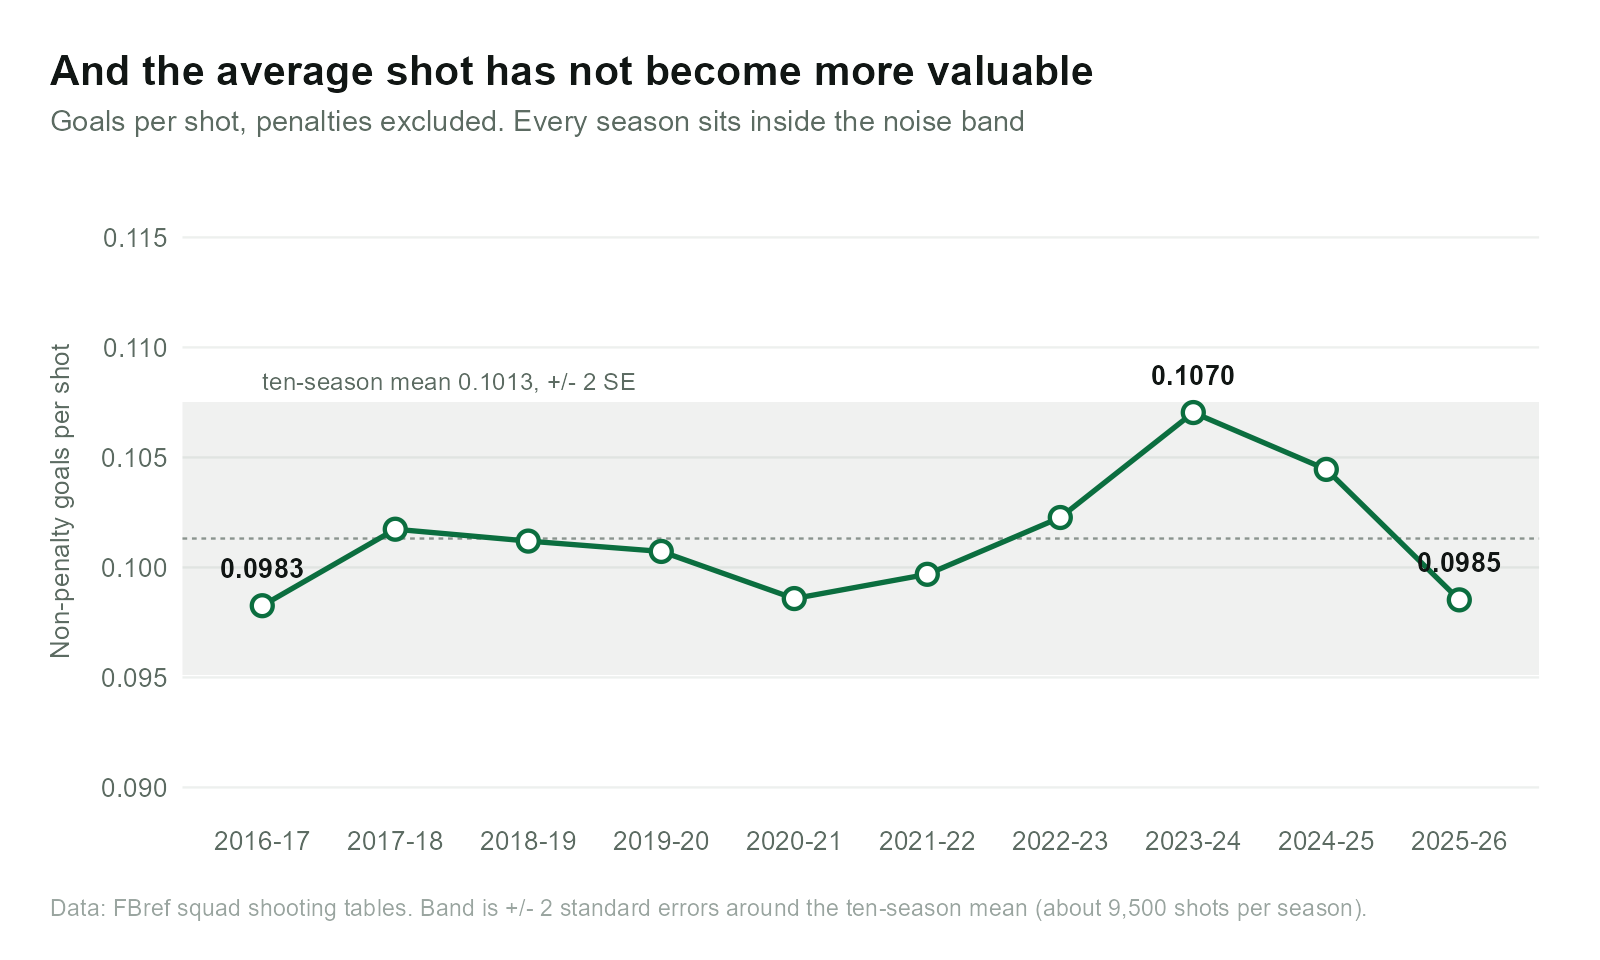
The average shot has not become more valuable. The non-penalty goals per shot was 0.0983 in 2016-17 and 0.0985 in 2025-26. The slope is +0.00034 per season (R² = 0.135). The mean over the ten seasons is 0.1013, with the ±2 standard error band is from 0.0951 to 0.1075. All of the ten seasons are inside this band. SoT% moves by +0.041 percentage points per season, with R² = 0.064. That line explains six per cent of the variation, which is to say nothing.
A season is about 9,500 attempts, and each attempt succeeds by roughly 10% chance. In this sample, the grey band is what can be produced with a pure chance.
There are approximately 9,486 non-penalty shots per season. At 80% statistical power, the minimum detectable effect is 0.0123. The actual end-to-first change is +0.0003, which is 2% of the minimum detectable effect. The change implied by the fitted line is +0.0031, which is 25% of the minimum detectable effect.
Therefore, prediction A does not hold as well.
The window matters
If I start measuring at 2017-18, the non-penalty goals per shot moves from 0.1017 to 0.0985, which seems like a decrease. This tendency flips just by adding a single season: 2016-17. Therefore, I used all the accessible intervals. This is a warning to my result. Using only ten dots makes the effect detection difficult.
What this does and does not show
This is not a refutation of Segar's finding. What Segar measured is the position distribution of shots, while this article measures the mean result of shots. There is a possibility that both can be true. There are three possible explanations.
- The position improved but the defense also improved so the effect is offset.
- As much as the shots outside the box are reduced, players attempt more difficult shots inside the box.
- The efficiency gain may always have been small.
With the data I have, I cannot determine which of the three explanations holds.
Limitations
- Goals per shot (G/Sh) is a result, not the quality of shots. It may include a finish fluke. npxG/Sh is the right metric but cannot be accessed.
- The ten seasons are expressed as ten dots. The detection ability of slow tendency is very weak.
- PK inclusion is not documented about the Sh.
- The shot position is not checkable. The mechanism that is the core of the discussion does not exist in the data.
Why this is hard now
The testable claim is established upon 22-season advanced Opta data. The records are inaccessible since January, 2026. The reader has no possible way to check.
What's next
In the next article, I am going to divide in and outside the box using the Understat coordinate data, and then rerun the analysis with expected goals.
Source. David Segar, "Analysis: Why are players shooting less from long range this season?", Opta Analyst / Premier League, 29 March 2025.
Data and code. All ten CSV exports and the R script that produced these figures are in this site's repository.